Art Data - Graphs & Charts
Art Data - Graphs & Charts v.2.2.9

1 Year Free Updates
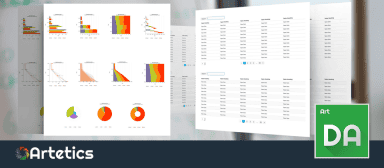

Art Data v2.2.9 makes it easier than ever to visualize data on a Joomla 3.x website. Create 2 types of tables and 12 types of charts. Custom templates can be created to control the look of your tables and charts. Quickly populate a table or chart using our built in dataset spreadsheet or you can load a dataset from SQL Query, HTML or CSV file. Add multiple visualizations on the same page to create cool, custom dashboards without the need for custom coding expertise!
Data visualizations are defined as "the creation and study of the visual representation of data".
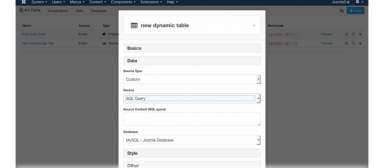
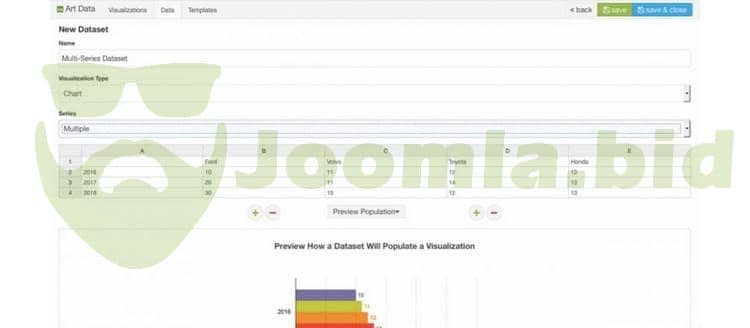
The 'visualizations' view is where you will configure your chart or table's basic options such as 'What type of visualization is this going to be? Table or Chart?', 'What type of Table or Chart?,' 'What template would you like to use with this visualization?', 'What dataset would you like to use to populate the visualization?'. You get the picture. The visualization is what ties everything together.
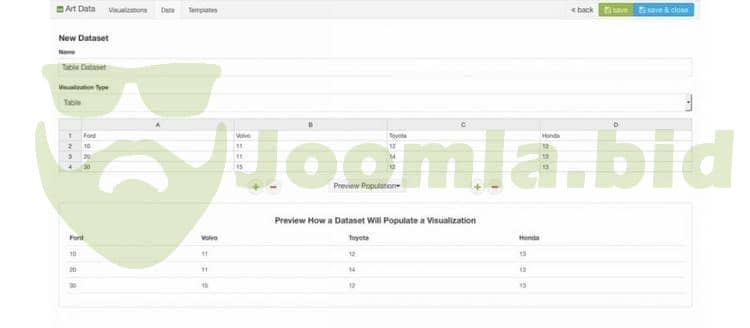
Visualization Type - Tables
- Create 'Static Table' - a basic table without sorting, filtering or pagination
- Create 'Dynamic Table' - a table with sorting, filtering, and pagination
- Populate table with custom dataset - SQL Query, HTML, CSV file
- Populate table with SQL Query for the following databases: MySQL - Joomla Database, MySQL - Other Database, PostgreSQL, MSSQL (mssql extension), MSSQL (sqlsrv extension), Oracle, Access, SQLite, Firebird, Informix, Foxpro, ADO, Sybase, FrontBase, DB2, SAP DB, Netezza, LDAP, ODBC, ODBTP
- Insert dynamic variables from the currently logged in user or from session in your SQL Query to add advanced functionality
- Populate table with ArtData dataset - use the quick, easy 'data' view to create a dataset by entering your data into a convenient spreadsheet-like application.
- Completely style your table with a custom theme using the 'templates' view
- Restrict table access level
- Show or hide table title
- Convert links and images automatically or by pattern
- Use rel="nofollow" on links
- Open links in a new window
- Control default pagination limit
- Control pagination limit choices
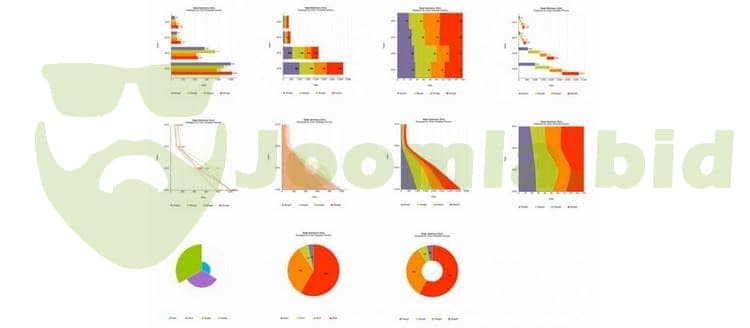
Visualization Type - Charts
- Create 'Bar Chart'
- Create 'Line Chart'
- Create 'Area Chart'
- Create 'Stacked Bar Chart'
- Create 'Stacked Area Chart'
- Create 'Pie Chart'
- Create 'Percent Bar Chart'
- Create 'Percent Area Chart'
- Create 'Donut Chart'
- Create 'Step Up Bar Chart'
- Create 'Polar Area Chart'
- Create 'Waterfall Chart'
- Charts load with cool data population animation
- Populate chart with custom dataset - SQL Query, HTML, CSV file
- Multi series custom SQL capability for charts
- Populate chart with SQL Query for the following databases: MySQL - Joomla Database, MySQL - Other Database, PostgreSQL, MSSQL (mssql extension), MSSQL (sqlsrv extension), Oracle, Access, SQLite, Firebird, Informix, Foxpro, ADO, Sybase, FrontBase, DB2, SAP DB, Netezza, LDAP, ODBC, ODBTP
- Populate chart with ArtData dataset - use the quick, easy 'data' view to create a dataset by entering your data into a convenient spreadsheet-like application.
- Insert dynamic variables from the currently logged in user or from session in your SQL Query to add advanced functionality
- Completely style your chart with a custom theme using the 'templates' view
- Restrict chart access level
- Show or hide chart title
- Control chart orientation - horizontal or vertical
- Set chart title
- Set chart sub-title
- Set horizontal axis label
- Set horizontal axis sub-label
- Set vertical axis label
- Set vertical axis sub-label
- Toggle chart download
- Set chart download label
Dynamic Variable Insertion for SQL queries
Below you'll see the variables that are available to use automatically from the currently logged in user. You don't have to do anything to set these values, they are built-in and available for use in your Art Data queries.
- {JOOMLAUSER_ID} -> The currently logged in user's user id
- {JOOMLAUSER_NAME} -> The currently logged in user's name
- {JOOMLAUSER_USERNAME} -> The currently logged in user's username
- {JOOMLAUSER_EMAIL} -> The currently logged in user's email
- {JOOMLAUSER_REGISTERDATE} -> The currently logged in user's date of registration
- {JOOMLAUSER_LASTVISITDATE} -> The currently logged in user's last login date
Custom set session variables can also be used. You can read more about this here:
2. Templates
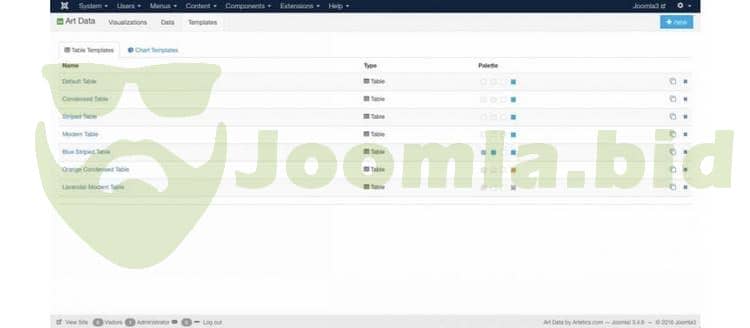
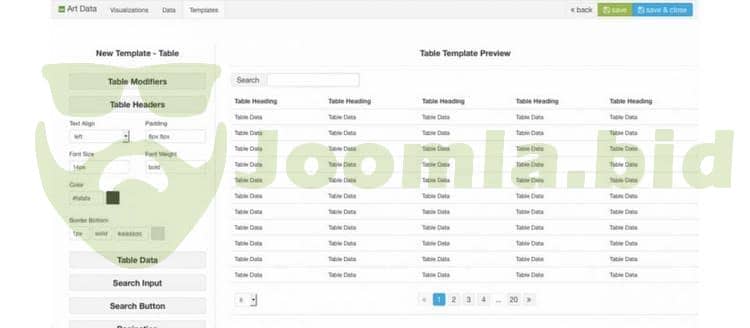
The 'templates' view is where you can customize nearly everything about the way a table or chart looks including color palette, responsive width %, class modifiers, text alignment, padding, border and more. Art Data allows you to customize pretty much everything about the look of the data visualization. Templates you create can be added to a visualization to easily apply a certain style.
You don't need to have any CSS knowledge whatsoever to use our template builder to style a table or chart template.
Template Type - Tables
- Create, edit 'template' for a table - style everything about your table
- Set table class modifiers - condensed, striped, hover
- Customize table header styles - text align, padding, font size, font weight, text color, border
- Customize table cell styles - text align, padding, border, striped background color
- Customize search filter input - height, width, padding, background, border, border radius, text color as well as onfocus styles
- Customize search filter button - padding, background, text color, border
- Customize active pagination - background, text color
- Customize non-active pagination - background, text color
- Customize focus & hover pagination - background, text color
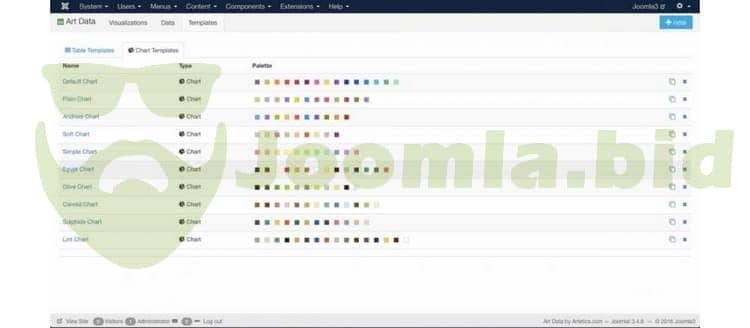
Template Type - Charts
- Create, edit 'template' for a chart - style everything about your chart
- Control main chart background, opacity, width and height
- Set axis lines color
- Toggle tick marks
- Set tick mark interval
- Set axis padding
- Control chart color palette
3. Data
The 'data' view is where you can create a dataset by entering your data into a web spreadsheet application that is built right into Art Data. The data view was specifically created for the purpose of easy data population because not everyone knows how to write an SQL Query. Create datasets specifically for tables or if you're using a chart then you can select either single series data or multiple series data. Formatting data for populating a visualization has never been easier.
- Create, edit 'dataset' for a table or chart
- For chart datasets choose between single series data or multi series data
- Enter your data into easy spreadsheet
- Create spreadsheet rows, columns
- Remove spreadsheet rows, columns
- Preview how a dataset will look when it populates a visualization
4. Deploying a Visualization on your Joomla Site
Art Data consists of a component, module, and plugin so you can deploy a table or chart on your site in whatever way you prefer.
Component
The component administrator is for creating and managing your visualizations. One way to deploy a visualization on the front end is to create a new menu item of type 'Art Data Visualization'. This will use the component output to display your table or chart and using this method the visualization will be the main part of the webpage.
Plugin
Another way to deploy a visualization is to use the content plugin. Using this method you can write [artdata id="1"] using the shortcode provided for you in the component administrator and you can put this shortcode anywhere on your site and it will be transformed into a visualization.
Module
The last way to deploy a visualization is to use the module. Simply create a new module instance and select the visualization you'd like to display from the module administrator area, select a template position where you'd like the table or chart to show up and you're done. Three great ways to deploy an Art Data Visualization on your Joomla 3.x site
Get 10 Cents for every review you add.
